
ONE-LINERS: Grow a picture or video from a single line of C or Python code
- One-liner input form with examples (this page)
- One-liner picture gallery
- One-liner video gallery
- One-liner quiz
- One-liner Q&A
- Back to John's pictures page
|
|
ONE-LINERS: Grow a picture or video from a single line of C or Python code
|
|
Here is the picture corresponding to the C-language expression in the form above:
Is this picture not what you expected? Check here. (The picture is an uncompressed .bmp so it is easy to download and save as a test image. The original purpose of one-liner pictures was fast and easy test image creation.) |
Copy/paste these into the form then edit to produce variants.
|
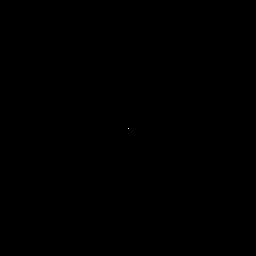
Let's make a dot at the centre of the picture: (x == 0 && y == 0) ? 1 : 0 which reads as, "If the x coordinate is 0 and the y coordinate is 0, then make the pixel equal 1. Otherwise make it equal 0. The picture produced (see to the right) actually gives the dot the value 255, the highest value an 8-bit image can take. This is because all generated pictures are re-ranged so the minimum is 0 and the maximum is 255. So we could have written "(x == 0 && y == 0) ? 255 : 0" or even "(x == 0 && y == 0) ? 100000 : 0" and it would produce the same result. With simple conditions like "x == 0 && y == 0", you don't actually need the brackets, so without them, and exploiting re-ranging, here are a couple more ways to make that impulse (which work because boolean false and true get re-ranged to 0 and 255): x == 0 && y == 0 !(x || y) |
 |
|
Because everything gets re-ranged, the ramp that was on this page originally (the picture that gradually shaded from black to white) doesn't need to use the expression x+128. Simply saying x is just as good. x If an expression doesn't mention colours the image will be monochrome (in black and white) like this one. Notice that this expression doesn't mention y either, so the result will be the same on every row. |
 |
|
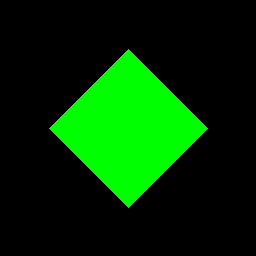
Green diamond As soon as you mention a colour you get a colour picture abs(x)+abs(y) < 80 ? green : black black, white, red, green and blue are keywords additional to normal C words. No other colours are named: you have to make them from the components. |
 |
|
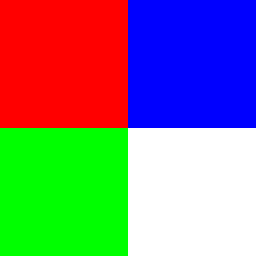
Flag (x<0&&y<0)*red + (x<0&&y>=0)*green + (x>=0&&y<0)*blue + (x>=0&&y>=0)*white You only get one C expression, or, if you like, one line of code, so when you want different things to happen in different parts of the picture it can get fiddly. I could have use the ternary operator (?:) to make the flag, but it's often clearer if you write each region's condition then multiply that by what you want to happen in that region, as I've done here. |
 |
|
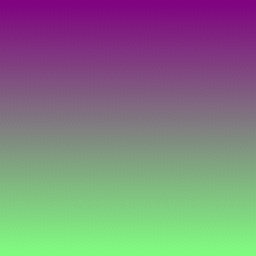
A couple of rows ago I said that 'x' was as good as 'x+128' for a horizontal ramp. That's true for monochrome images, But re-ranging works over all three colour components (red, green and blue) so beware! For example, this is a green=-128 to green=+127 ramp, this time vertically. y*green Why does a green ramp have other colours? Because the range of values of y is [-128,127], so when the picture is re-ranged, 128 gets added to all of red, green and blue. red and blue were 0, because they weren't mentioned, but now they're 128, so in the top half of the picture, where green is lower than them, the colour is magenta. If you want a pure green ramp, you have to do: (y+128)*green |
 |
|
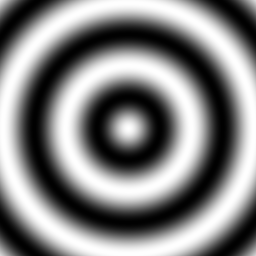
Circular cosine cos(sqrt(x*x+y*y)/10.0) Because of re-ranging, this is just as good as: 128 + 127*cos(sqrt(x*x+y*y)/10.0) |
 |
|
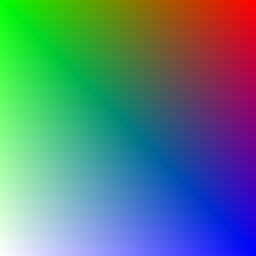
A coloured field abs(x-y)*red + (127-x)*green + (y+128)*blue |
 |
|
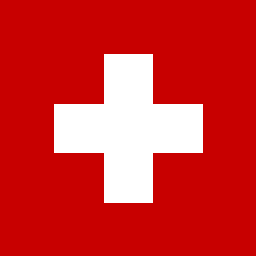
Swiss flag. (abs(x) < 25 && abs(y) < 75 || abs(x) < 75 && abs(y) < 25) ? white : 0.8*red For a colour image, you can multiply by white as shorthand for multiplying red, green and blue equally. |
 |
|
Bulb abs(x*x*x + y*y*y) < 90*90*90 ? 128*green + (128+x)*red + (255-abs(x+y))*blue : black |
 |
|
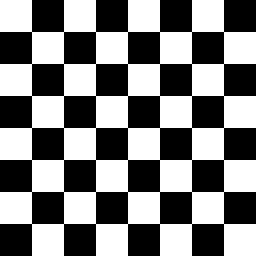
Checkerboard x & 32 ^ y & 32 ? black : white Try "x & 32 ^ y & 32 ? x : y" for a strange variation. |
 |
|
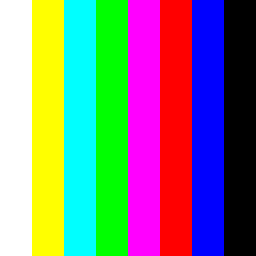
Colour bars x > 96 ? black : x > 64 ? blue : x > 32 ? red : x > 0 ? red+blue : x > -32 ? green : x > -64 ? green+blue : x > -96 ? green+red : white Not the easiest way to generate colour bars! |
 |
|
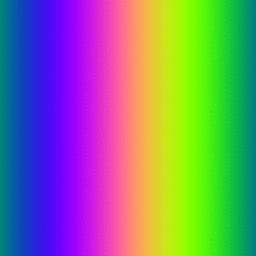
Painterly colour bars sin(x/40.0)*green + cos(x/40.0)*red + sin(-x/40.0)*blue By now it's getting clear you sometimes have to repeat yourself in the one-liner. As that happens more often, you'll see that the picture specifications become longer and harder to read. Writing is not so bad though, because you try out something simple first and then copy-and-paste to get what you really want. |
 |
|
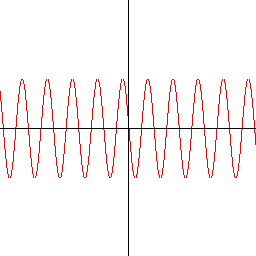
A sine wave graph x != 0 && y != 0 && ((y-50*sin(x/4.0))*(y-50*sin((x-1)/4.0))<0 && red || white) To draw graphs like this, you have to detect zero-crossings. Notice use of the sequential and condition evaluation of && . This is handy. |
 |
|
An optical illusion Not the most readable, but probably the shortest statement of the cafe wall illusion: ((y&31)==0)&&16||(x+((y&32)>>2) & 32) |
 |
|
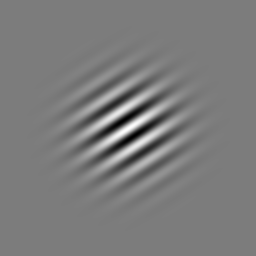
A bit of image processing: Gabor filter point spread function exp(-0.5*(x*x/(20.0*20)+y*y/(20.0*20)))*cos(x/4.0) |
 |
|
Another Gabor filter (different variance, centre frequency and orientation) exp(-0.5*(x*x/(30.0*30)+y*y/(30.0*30)))*cos((x*cos(1)+y*sin(1))/3.0) |
 |
|
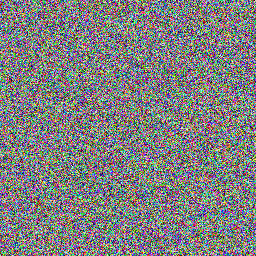
Uniformly distributed noise rand() % 256 |
 |
|
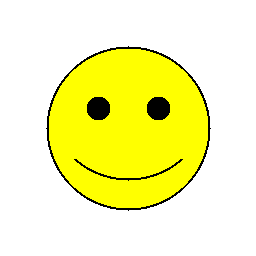
Smiley x*x + y*y > 82*82 ? white : x*x + y*y >= 80*80 || (x+30)*(x+30)+(y+20)*(y+20) < 12*12 || (x-30)*(x-30)+(y+20)*(y+20) < 12*12 || x*x + (y+30)*(y+30) >= 80*80 && x*x+(y+30)*(y+30)<=82*82 && y > 30 ? black : red + green |
 |
|
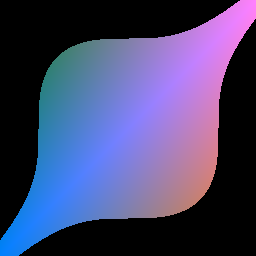
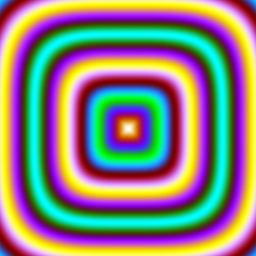
And finally, the pattern from which my site logo is derived: cos(sqrt(sqrt(x*x*x*x+y*y*y*y))/10.0)*red + cos(sqrt(sqrt(x*x*x*x+y*y*y*y))/5.0)*green + cos(sqrt(sqrt(x*x*x*x+y*y*y*y))/3.0)*blue This one illustrates what I was saying about being easier to write than to read: The basic idea here is simple: it's repeating the sqrt(sqrt(x*x*x*x+y*y*y*y)) that makes this long and hides the trick that makes it so colourful: the different denominators for the three colour components. |
 |
|
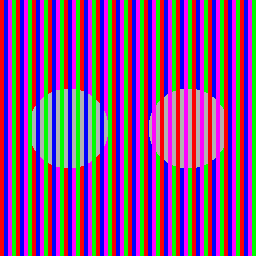
The Gallery and the Quiz have many more pictures, including this colour illusion. |
 |


